
Optimum Plant Concepts for Biopharmaceutical Production: Comparison, Evaluation and Innovation in a Unique Case Study
Have you ever faced the task of having to develop the best plant concept for a biopharmaceutical production plant? Have you ever had to technically evaluate a plant design during the planning phase or, maybe, approve the project implementation, including a multi-million-dollar budget?
Then you will be aware that there is no such thing as THE best plant concept.
Complex investment projects in the pharmaceutical sector combine a variety of disciplines, need to take external and internal regulatory requirements into account, should be as cost-efficient as possible in terms of both the project implementation and operation, and should also have a minimal CO2 footprint.
Despite all this, these requirements can be reconciled. A GOOD plant design considers all factors in a balanced way and can be completed within a defined time frame with the anticipated planning reliability.
As an EPCMv general planner, the VTU Group brings all the project-relevant disciplines together under one roof – as well as expertise in the areas of Manufacturing Science and Technology or Sustainability. This is the result of a pool of 10,000 years of experience in planning and expertise – for both the completion of an investment project and the manufacturing process or technology transfer as well as the day-to-day operation of the plant.
In this context, we have developed a multidisciplinary case study for a large-scale biotech plant which compares five different design variants for the buffer area of a downstream process and which we are publishing as a 3-part mini-series. In this respect, the calculated values for CAPEX, OPEX and the CO2 footprint are compared.
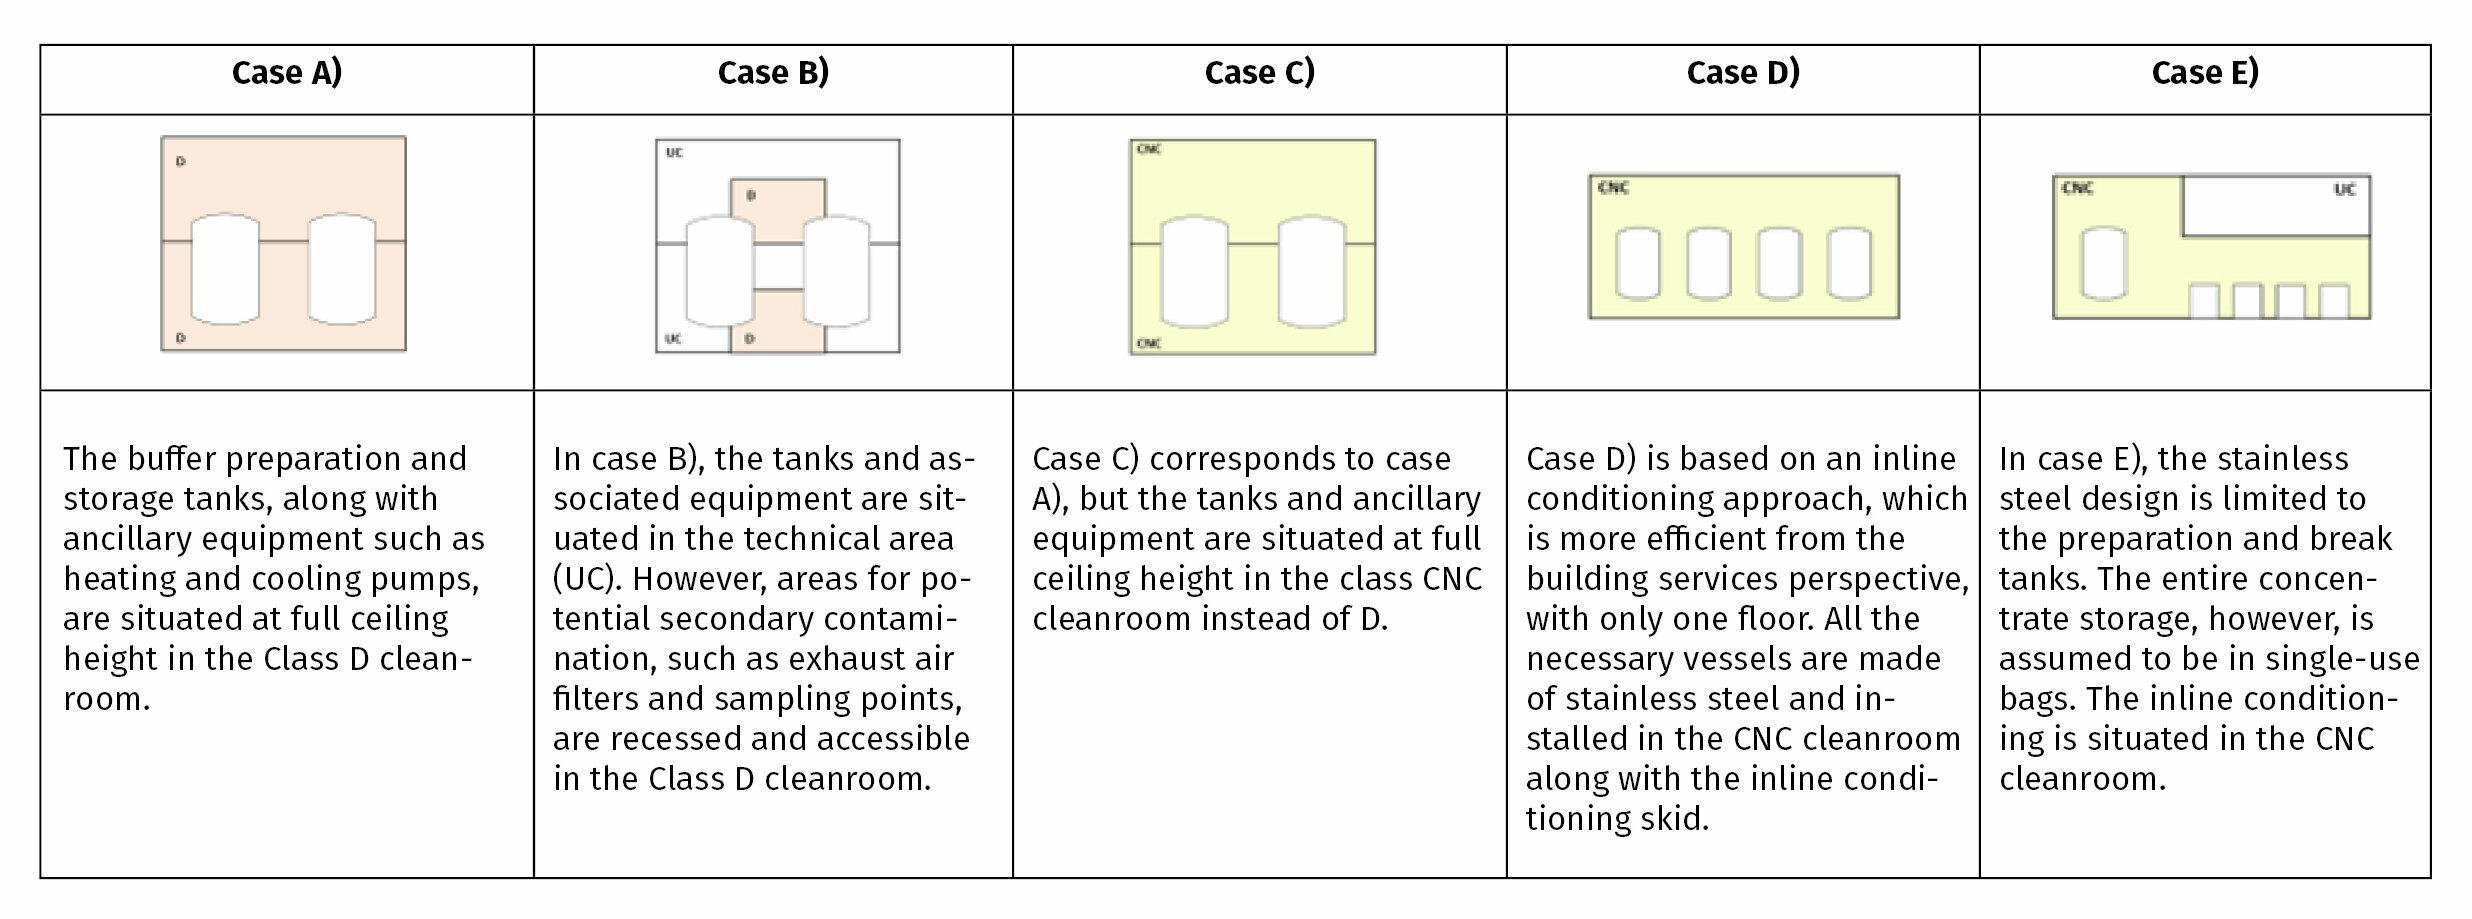
A conventional form of buffer production and storage with large stainless steel tanks is considered for three different cleanroom designs, each derived from completed projects (cases A), B) and C) below)).
In addition to this, the conventional process design is compared with an inline conditioning approach. In this context, buffer mixtures are prepared as concentrates and then mixed on an inline basis during the ongoing downstream process and diluted with WFI. Unlike inline dilution, in which a concentrate is diluted with WFI, up to five components or more can be mixed. This can reduce the number of concentrates to be mixed.
In terms of the plant technology, the inline conditioning is implemented completely in a stainless steel design (case D), but also with the highest possible share of single-use bags (case E), with the necessary break tanks, for example for WFI, being made of stainless steel.
What exactly are we comparing?
For the conventional design with buffer storage tanks, we took a total volume of 250 m³ as the basis. This corresponds to a total net bioreactor volume of 120 m³ and an assumed average batch number of 3.5 per week.
The following cases are distinguished between:
What is the background to our choice?
The standard design approach is to mix the buffers in vessels and then store them in storage tanks. In large-scale plants, this sometimes results in very large storage tanks with volumes of 15 to 20 m³, which, depending on the process, are ideally located on upper floors. This results in high overall costs for the tanks, the cleanrooms, the structural engineering and the corresponding ventilation.
More recent design approaches include inline dilution or inline conditioning, which minimise or even eliminate the use of storage vessels. In the case of inline dilution, the buffer is diluted from a base chemical with WFI at the time of use in the downstream process, for example, 1 molar NaOH from 25% NaOH.
In the case of buffers consisting of dissolved solids and also composed of various solid or liquid components, a simple inline dilution is no longer possible or would be too complex to control. In this case, however, buffer concentrates, i.e., component mixtures, can be produced which can be mixed “on demand” at the time of use in the downstream process and diluted with WFI.
Compared with the standard design approach, inline dilution and conditioning in particular results in smaller vessel volumes and lower ceiling heights. Alternatively, the building can be reduced by one floor in the buffer area, thus reducing the related costs, including the associated ventilation costs.
The new design approaches, however, require additional equipment such as break tanks or a large number of smaller concentrate storage vessels, some of which are constructed using chloride-resistant materials for concentration reasons. Since the instrumentation and automation are independent of the tank size, it is unclear from the outset whether the new approaches will actually minimise the costs in terms of investment.
Thanks to smaller storage volumes, however, it is possible to rely on single-use systems. These not only reduce investment costs, especially when chloride-resistant materials such as Hastelloy are required, but also limit the workload required for cleaning and sanitisation. However, they obviously increase the costs of consumables during ongoing operations.
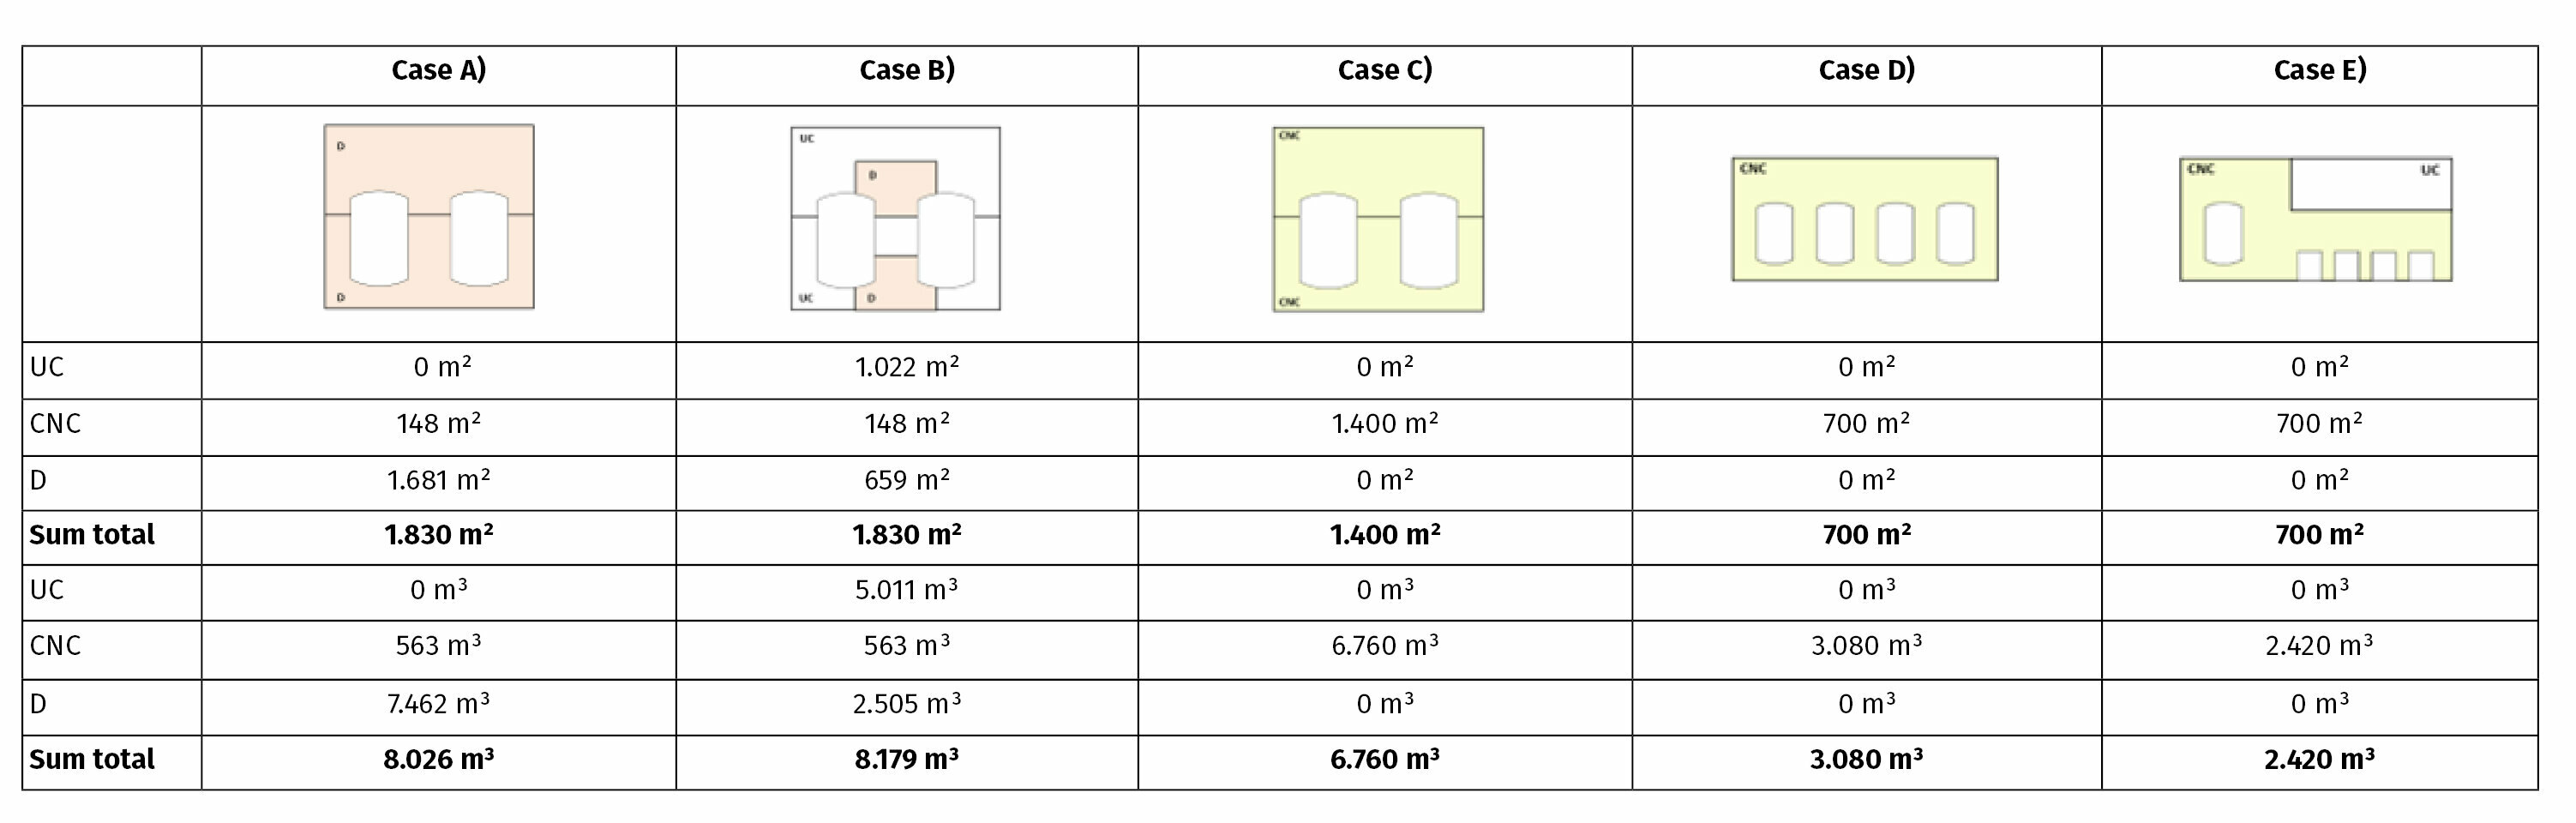
The results indirectly demonstrate the potential for savings in terms of investments. The strikingly large difference in area between cases A) and C) results, on the one hand, from the additional outlay required for airlocks and corridors to access the Class D cleanroom via CNC. On the other hand, case A) entails a rigorous separation of the incoming and outgoing materials as well as waste. Therefore, the access corridors, including airlocks, are approximately twice as large in case A) as in case C).
The different floor areas and room volumes have a direct impact on the investment costs and, due to the necessary ventilation systems, also on the operating costs. However, the required plant technology is more complex in cases D) and E), which increases the investment costs of the equipment.
This raises the question of how the different cases compare with each other in terms of their respective cost factors.
In the second part of the case study, we compare and analyse the investment and operating costs (CAPEX/OPEX).