
Costs and CO2 Footprint
In Part 1 of this case study, we defined the framework for five possible design variants for the preparation of a buffer in a biotech plant.
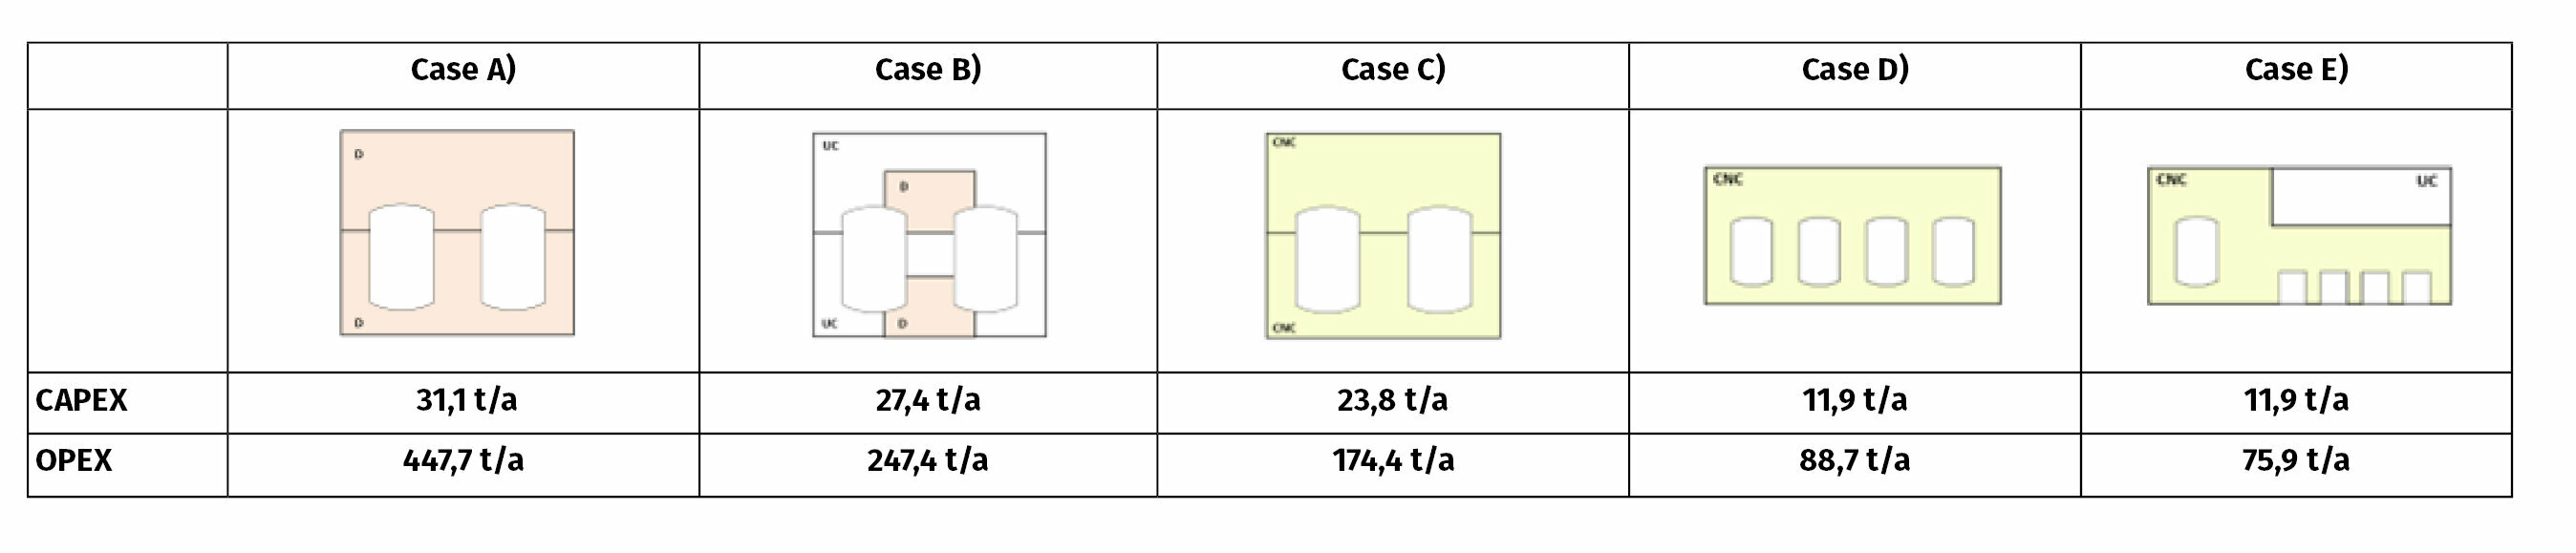
In this second part, we compare the associated investment and operating costs.
Investment costs / CAPEX
It should be noted that an estimate based on generic benchmarks applied to individual plant areas is associated with a degree of uncertainty. This case study is not concerned with absolute numbers, however, but rather with the relationship between the individual design cases.
For construction/architecture/structural engineering (CSA) and building services including ventilation (BS), the cost estimate was based on benchmarks from completed projects. The subtotal for “Equipment” includes the costs of the equipment, installation, pipelines, measurement and control systems as well as automation. The equipment costs are based on current market prices (2023). The CAPEX comparison does not take the utility infrastructure component into account, but it does consider the difference in CIP satellites. The engineering costs are calculated using an EPCMv model, which includes the relevant services for planning and project management, including qualification and validation.
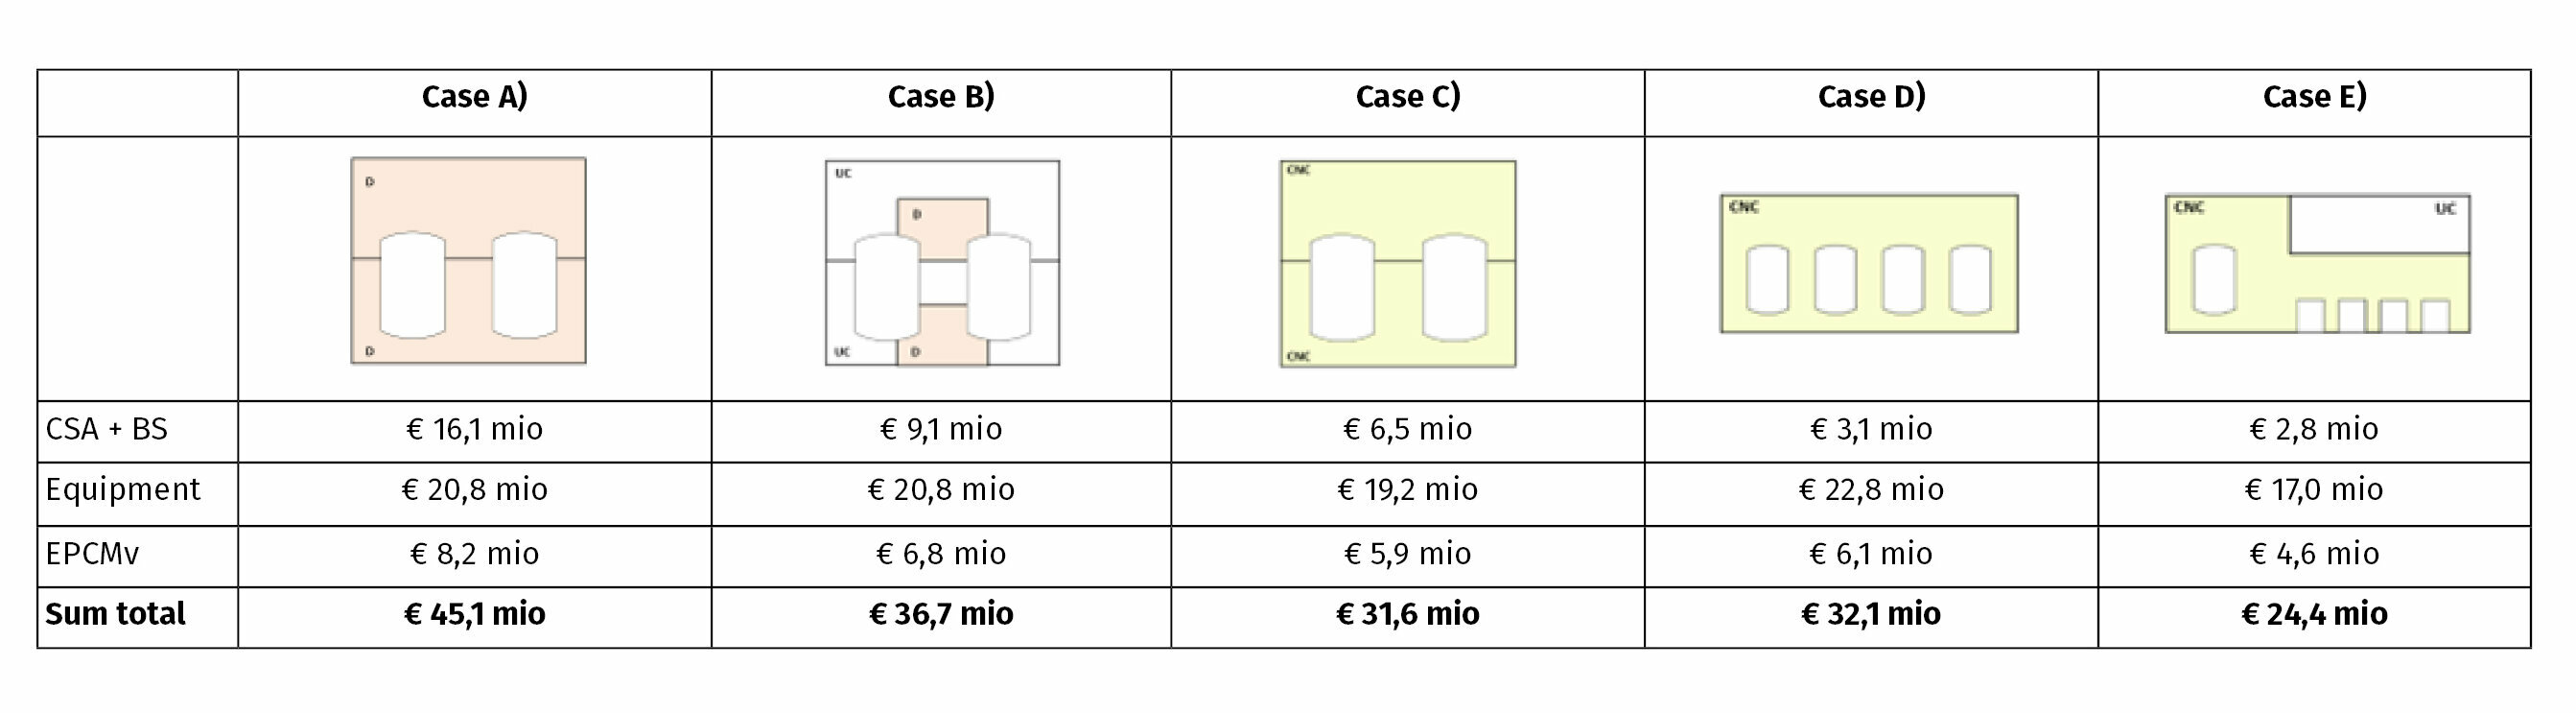
The cost ratios for buildings (CSA) and building services (BS) are proportionate to the areas and volumes. However, the high process-related shares for cases D) and E) are striking. These arise from the larger number of vessels. Although these are smaller in volume, this results in almost no cost savings on the process-related pipelines, instrumentation or automation.
The estimate for the total investment costs shows that an inline conditioning approach with single-use storage only amounts to half the investment costs compared to the conventional approach with the highest possible room classification. Surprisingly, the inline conditioning approach with stainless steel tanks (case D) is similar in costs to the conventional design approach (case C). This is because the savings in space and volume are offset by the increased number of vessels together with the automation.
CAPEX-related implications:
Lower requirements concerning the cleanroom class and the minimising of the cleanroom volumes, especially for higher cleanroom classes, have a cost-reducing effect on investments. Case D) would be a conceivable option if, for example, the building height were limited. However, from an investment perspective, a single-use approach similar to case E) is clearly preferable.
The interesting question now is how the operating costs compare in relation to this.
Operating costs / OPEX
In terms of the operating costs, only those cost items that differ significantly across the five cases considered were compared. These are primarily the energy costs for the building services and ventilation, as well as the costs of cleaning (CIP) and sanitising (SIP). Personnel costs are not included. Consumables were only considered for single-use bags, but not for vessel exhaust air filters.
The operating costs of the building services were estimated using benchmarks. The following ventilation rates were applied: 3-fold for UC, 6-fold for CNC, and 16-fold for D. The operating costs for CIP/SIP were derived from the batch plans and the associated mass balance calculations.
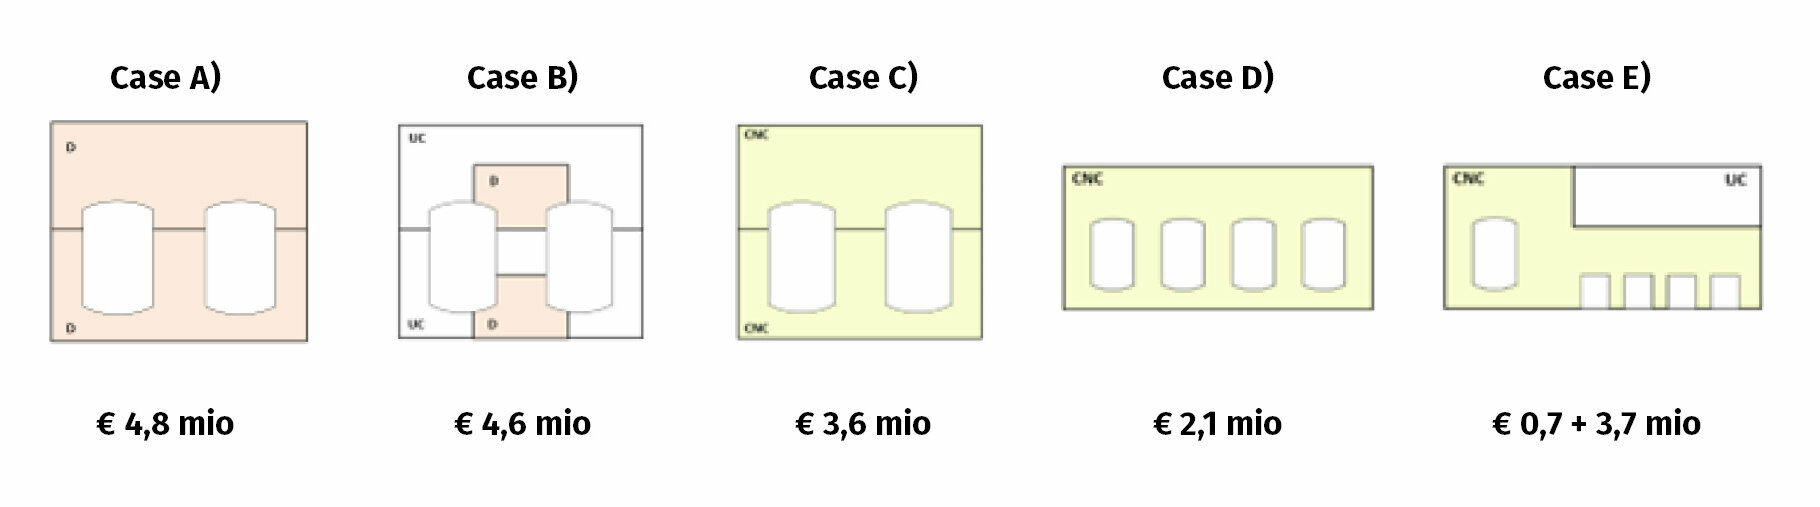
The operating costs for building services directly correlate with the room volume and the assigned cleanroom classes. In process operation, however, cases A), B), and C) differ little, as the vessels and their volumes are identical.
In case D), the vessel volume to be cleaned is only a third of that in cases A), B), and C; in case E), it is only a fifth. This means that the cleaning workload is basically lower, and the use of concentrates also reduces the preparation frequency in the smaller buffer preparation tanks.
In case E), the operating costs are low, but the costs of the single-use bags are significant.
For plant operation including buildings with a 15-year operating period, the cumulative costs (OPEX+CAPEX), using static calculations and without adjustment for inflation, are:
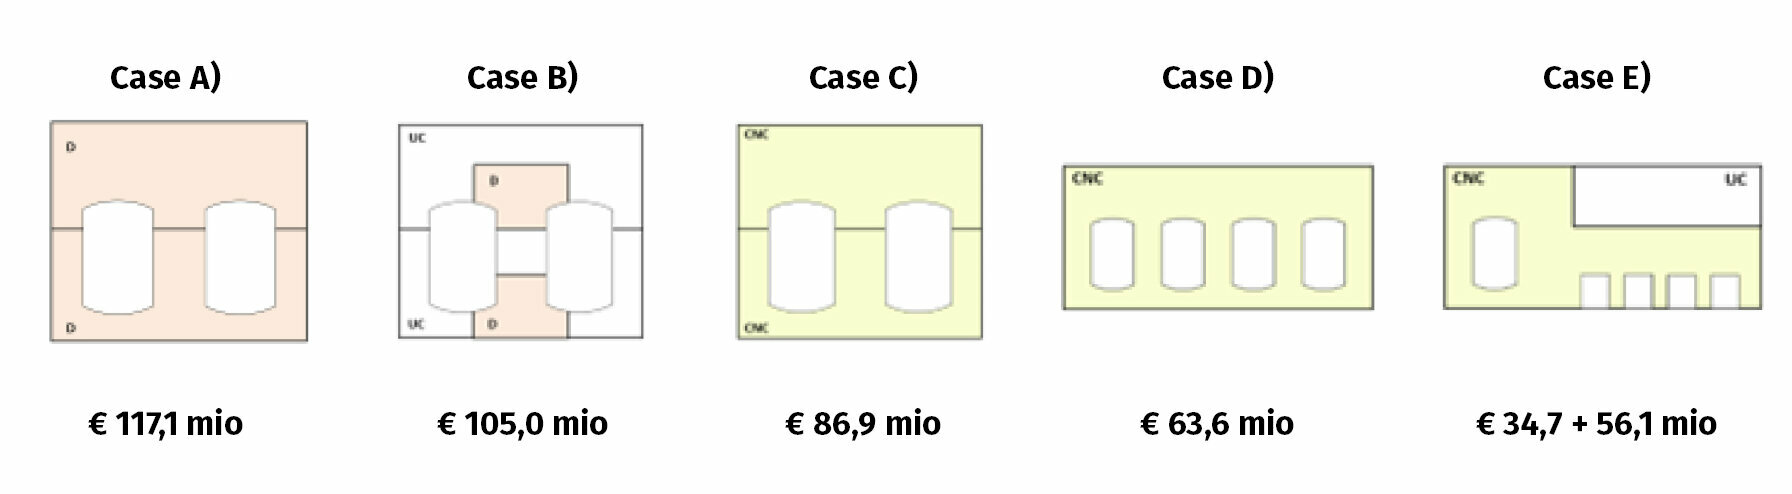
Cases D) and E) are deliberately based on opposing assumptions in the plant design. In practice, however, combinations of these approaches are often implemented. In the case of high-throughput buffers, such as caustic soda, it is more cost-effective to provide dedicated stainless steel distribution systems. This immediately and significantly reduces the costs of single-use bags.
Since environmental impacts are increasingly becoming a focus of attention alongside monetary costs, the differences in the CO2 footprints are discussed below.
Offsetting of CO2 footprints
For many projects, especially large ones, VTU now calculates and evaluates the CO2 footprint during the project planning phase using the greenSPEED™ – efficiency improvement package - VTU Engineering. This not only includes operation, but also the energy used to manufacture the building components and systems (referred to as grey energy).
Sufficient information on CO2 emissions equivalents is now available in relevant databases, for buildings, for example. Recent data concerning energy sources is available from the Federal Environment Agency. CO2 emissions equivalents for the use of chemicals from ongoing operations have not been offset.
As regards ongoing operations in particular, the data is highly dependent on the site-specific energy mix used. The CO2 emissions equivalents for electricity were calculated on the basis of the EU27 average. It is further assumed that the supply of steam was based on natural gas. Therefore, the data presented below cannot easily be transferred to a specific location.
In terms of the grey energy, it is important to remember that the life cycles of the various plant components vary. A lifespan of 50 years was assumed for the building, while experience has shown that key processing systems are completely replaced up to three times during this period.
In accordance with the assumptions outlined above, it can be seen that, with a conventional energy source mix, the majority of CO2 emissions (approximately 90%) are generated during the operation of biotech plants. This ratio changes significantly, however, if the steam generation is carried out using renewable energy sources, for instance.
The CO2 emission equivalents for the plant structure (CAPEX) are directly proportional to the areas or the converted volumes. The CO2 emission equivalents for plant operation (OPEX) are made up of shares for the operation of the cleanrooms (electricity) and the energy required for cleaning and sanitisation (CIP/SIP). The first share, like the plant structure, is strongly dependent on the converted volume. CIP and SIP, on the other hand, correlate with the container surface to be cleaned and are therefore proportional to the container volume.
What conclusions can we draw from the data presented?
In the third part, we will explore the relevance of the data for decision-makers and project managers.